On this page
Struggling to interpret your customer satisfaction scores? You're not alone. Most support teams stare at a 75% CSAT and wonder: Is this good or bad? The answer? It depends entirely on your industry, your channel, and what your customers expect. This guide breaks down real CSAT score benchmarks by industry, explains what a "good" score actually means, and shows you how to move the needle, especially in tough sectors like telecom and healthcare.
Who this is for: Customer support managers, CX leaders, and ops teams in telecom, healthcare, and B2B SaaS who want to benchmark accurately and improve without guessing.
When to use this guide: Before you buy new support tools or hire more agents. Use it to figure out why your scores are stuck and what to change.
When NOT to use this guide: If you're chasing a vanity number, this isn't about inflating scores. It's about digging into root causes and fixing real problems.
Quick Answer
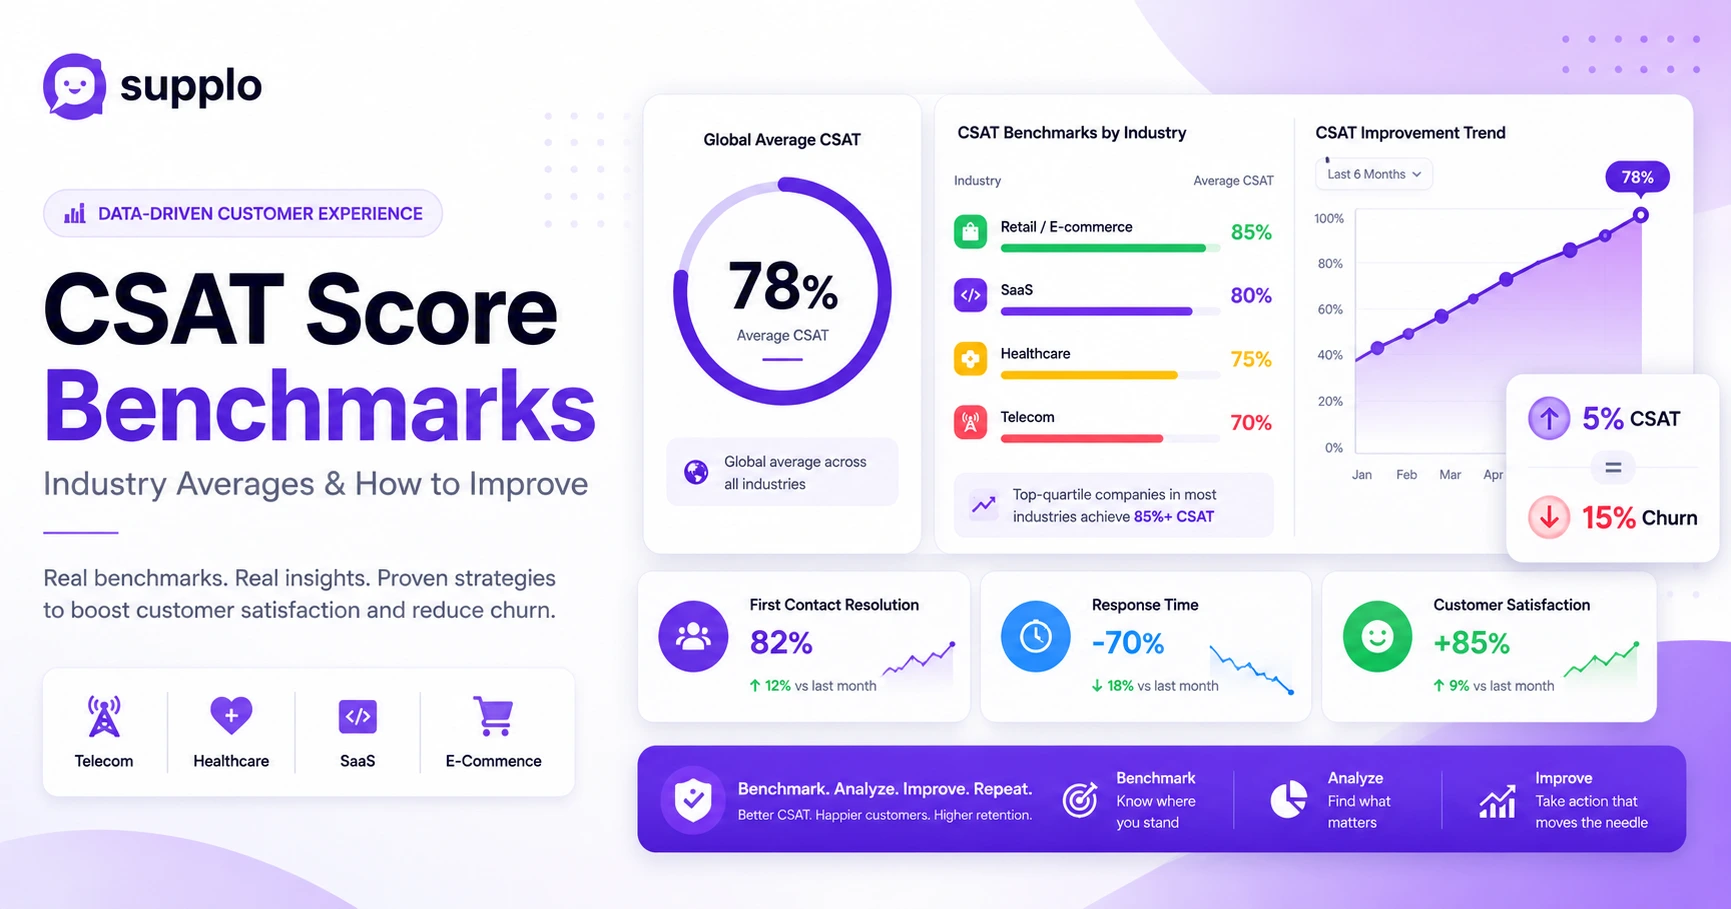
- Global average CSAT across all industries: 75–80%.
- Telecom average: 68–72%, the lowest major sector.
- Healthcare average: 70–80%; highly variable by visit type.
- Retail/e-commerce: 80–88%, highest among B2C sectors.
- Top-quartile companies in most industries hit 85% or higher.
- A 5% increase in CSAT can reduce churn by 10–15% in the telecom industry.
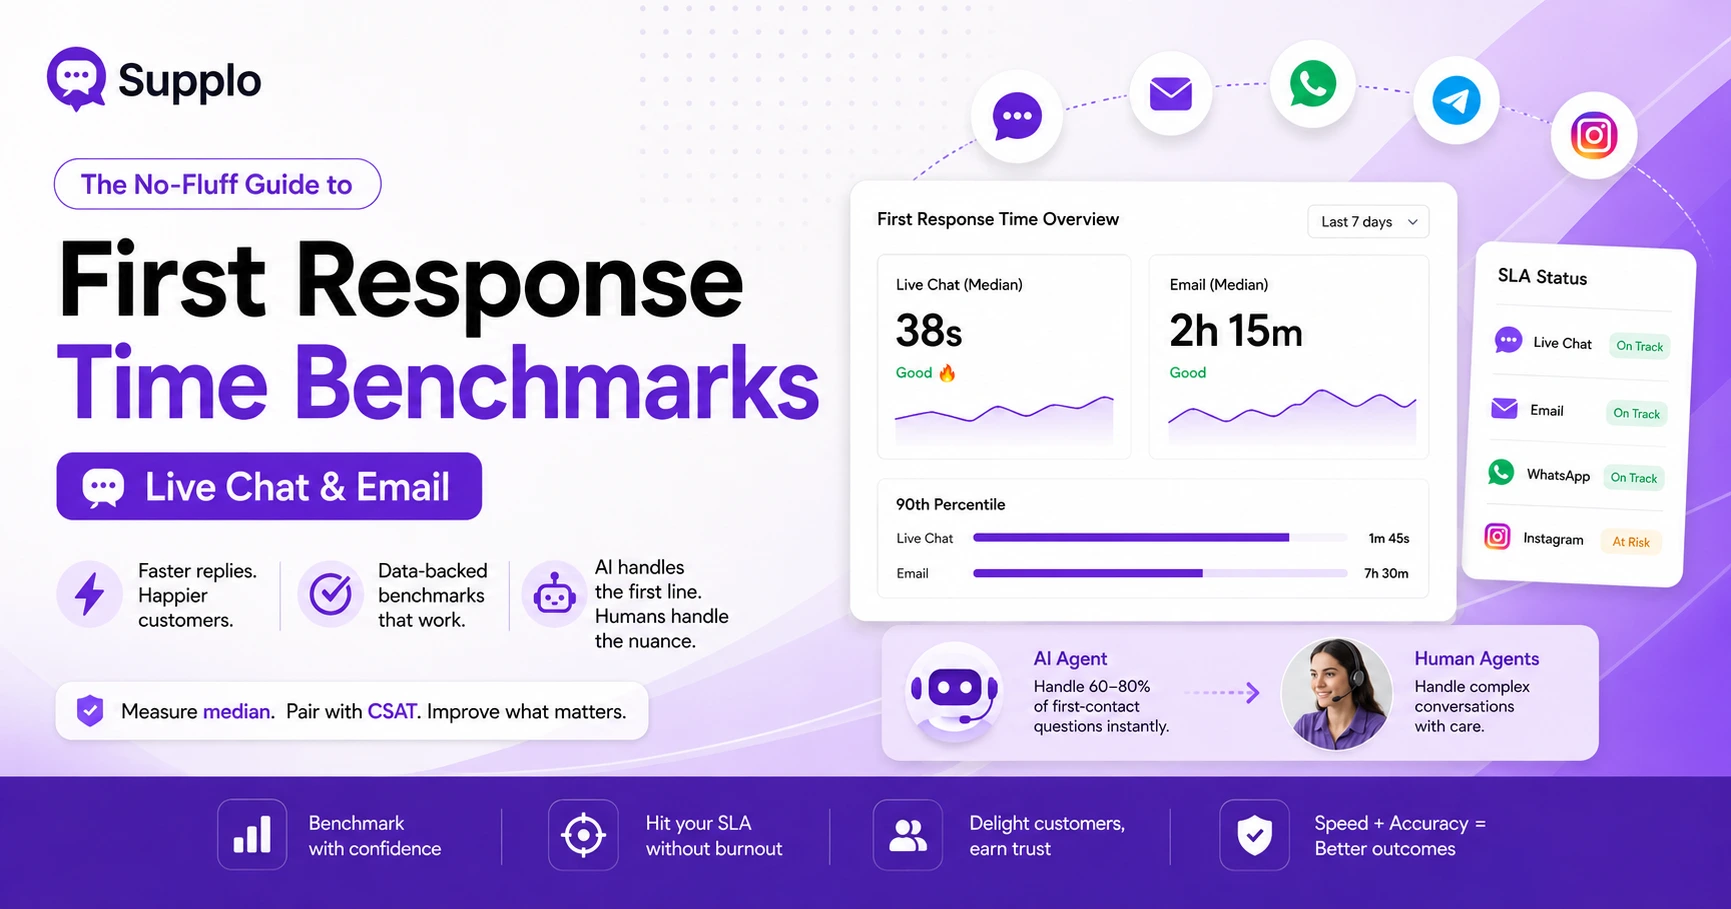
- First Contact Resolution (FCR) is the #1 leading indicator of CSAT.
What Are CSAT Benchmarks? (And Why You Can't Just Pick a Number)
CSAT score benchmarks are industry-standard metrics that indicate whether your customer satisfaction score is competitive or concerning. Here's the kicker: a "good" CSAT for a SaaS company is often a "bad" score for a telecom provider. These benchmarks normalize your feedback against similar organizations, factoring in industry-specific pain points like call wait times, billing complexity, and resolution speed. Without them, you're comparing apples to grenades.
- Benchmarks shift wildly by sector; retail usually lands at 75-85%, while telecom often hovers around 65-75%.
- The CSAT score itself comes from a single question: "How satisfied were you with [experience]?" scored on a 1-5 or 1-7 scale.
- Industry benchmarks filter out noise from wildly different expectations; someone ordering a pizza has lower stakes than someone waiting for an MRI result.
- Without benchmarks, a 72% score might feel "fine" until you learn your closest competitor is at 84%.
- The most reliable CSAT benchmark reports aggregate data from thousands of companies, not just a handful of surveys.
Supplo is not affiliated with any app or website. Please follow each app's terms and local regulations.
A 72% CSAT can feel acceptable until your competitor's benchmark report shows they're hitting 84% in the same industry.
Average CSAT Scores: What a "Good" Score Actually Looks Like
The global average CSAT score across all industries tends to range from 75% to 80%. But "average" is dangerous when you're trying to grow. A score of 80% might be above average for telecom (which often dips to 68%), but it's below average for a premium e-commerce brand where 85% is the floor. The most useful average CSAT scores are segmented by industry, channel, and ticket type, because your live chat CSAT will almost always beat your email CSAT.
- Top-quartile companies in most industries hit 85% or higher; bottom-quartile companies drop below 65%.
- Industry averages mask variance; healthcare's average is pulled up by private practices and pulled down by insurance carriers.
- Average CSAT scores are only useful if you're comparing like-for-like: B2B support desks average higher (78-82%) than B2C live chat (72-78%).
- The "acceptable" floor in telecom is roughly 70%; below that, churn rates spike by 15-20%.
- A single bad score from a high-value patient can tank your healthcare CSAT more than ten bad scores from low-ticket retail buyers.
CSAT Benchmarks by Industry: Where You're Probably Falling Behind
CSAT benchmarks across industries reveal significant gaps in customer expectations. Telecom and healthcare consistently rank among the lowest sectors, often scoring 10-15 points below retail or SaaS. Why? Because customers in these industries contact support under higher stress (billing disputes, appointment delays, service outages) and expect faster, more empathetic resolutions. If you're in a low-scoring industry, a 70% CSAT might be median, but it's still losing you customers to competitors who invest in better support tools.
- Retail & E-commerce: 80-88% – customers want fast issue resolution and easy returns.
- SaaS & Technology: 75-85% – expectations are high for self-service and chat response times.
- Telecom: 65-75% – common pain points: billing, connectivity, and hold times.
- Healthcare: 70-80% – patients value empathy, privacy, and appointment accuracy above all.
- Financial Services: 72-82% – strict compliance and long verification processes lower scores.
Telecom and healthcare customers contact support under higher stress. Their CSAT averages reflect that, and the best tools reduce that friction.
Telecom CSAT Benchmarks: Why Customers Hang Up (and How to Fix It)
Telecom CSAT benchmarks are notoriously brutal: the industry average hovers around 68-72%, with some sub-sectors (ISP support, prepaid mobile) dipping under 60%. The biggest drivers are long wait times, frustrating IVR menus, and the inability to resolve billing disputes in a single touch. Customers don't call support because they're happy; they call because their internet is down or they were overcharged. The expectation is not delight; it's speed and accuracy.
- Typical telecom resolution cycles span 3+ interactions before closure, cratering CSAT.
- First Contact Resolution (FCR) is the single biggest predictor of telecom CSAT, yet most carriers score below 65%.
- Omnichannel routing (WhatsApp, Telegram, email) can lift telecom CSAT by 5-8 points by letting customers choose their preferred channel.
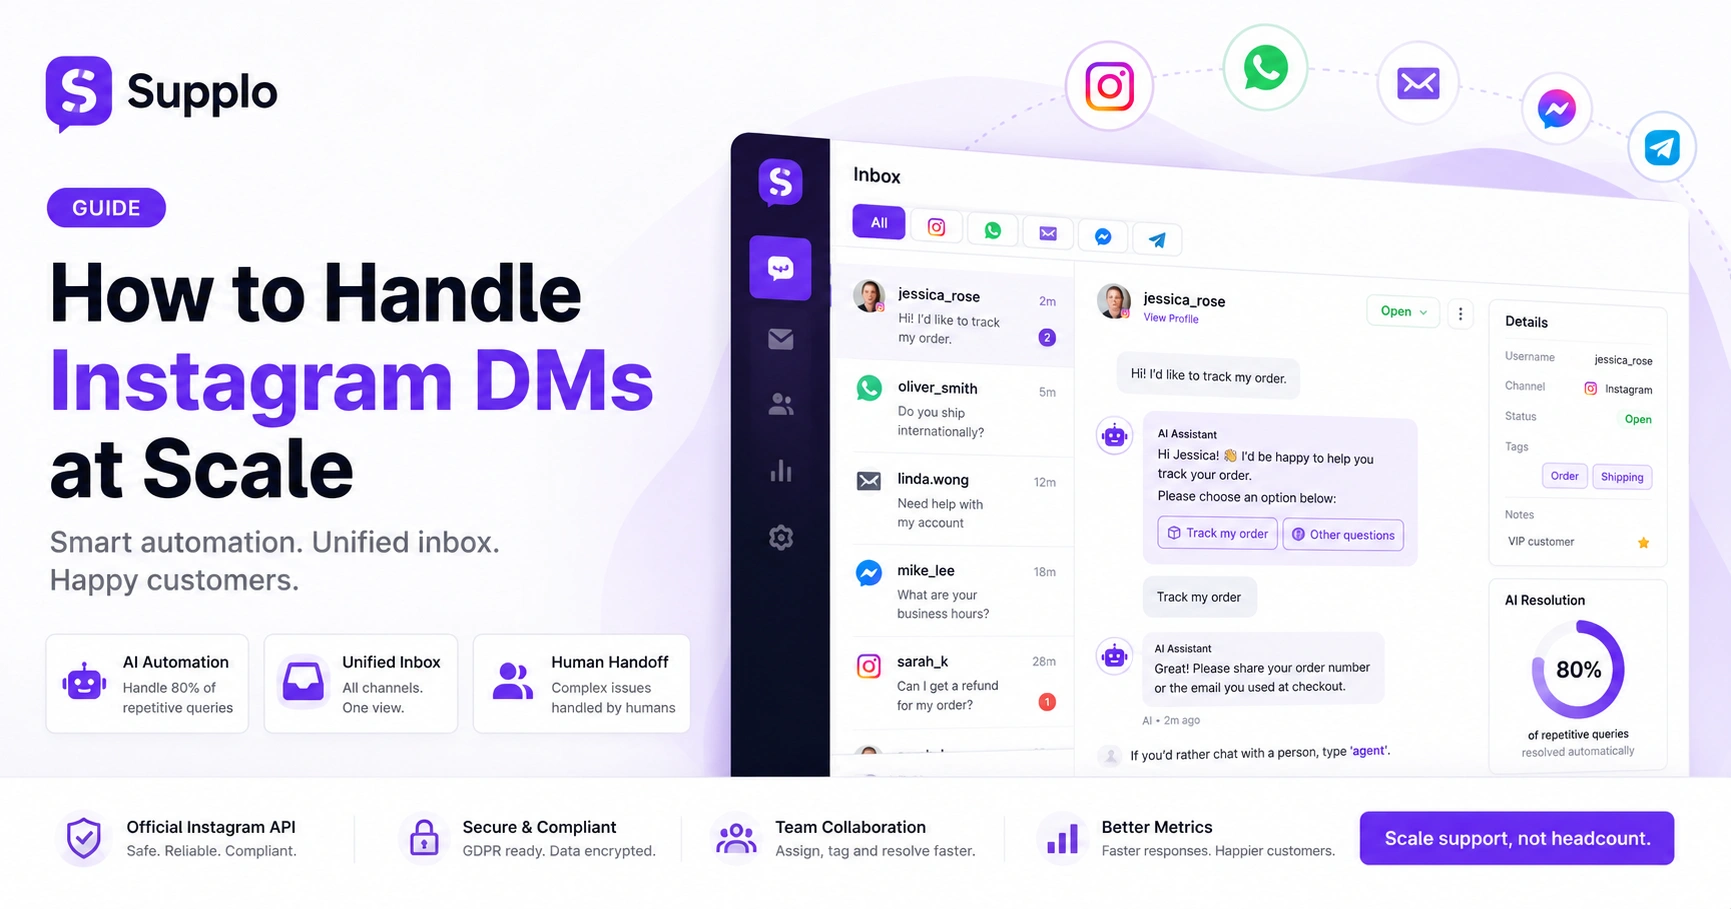
- AI auto-resolution for password resets, plan changes, and outage checks can defuse the highest-volume tickets before a human ever touches them.
- Telecom support teams that unify live chat, email, and social DMs into a single inbox see a 10-15% CSAT improvement.
How to improve: Deploy a self-learning AI agent to auto-resolve password resets and plan changes. Pair it with a Telegram support integration to give customers a channel they actually want to use.
Healthcare CSAT Benchmarks: The Patient Satisfaction Score Benchmarks That Matter
Healthcare CSAT benchmarks run 70-80% lower than those in most B2B industries but higher than those in telecom. The curve is different: a single visit experience (wait time, bedside manner, billing clarity) can swing a score from 40% to 100%. Patient satisfaction score benchmarks focus heavily on communication quality, appointment accessibility, and follow-up responsiveness. If your healthcare support is stuck in email-only or phone-tree limbo, you're leaving points on the table and patients on the doorstep of competitors.
- Press Ganey and similar surveys find that "time to answer" is the #1 driver of patient CSAT.
- Healthcare support teams using live chat see 12-18% higher patient satisfaction than those using phone-only.
- Multi-language capability (e.g., auto-translate in chat) is a major differentiator in patient feedback.
- HIPAA compliance and data privacy are non-negotiable; any breach or visible mishandling tanks CSAT fast.
- AI agents that triage appointment changes or prescription refills free up human agents to address complex patient concerns, directly boosting satisfaction.
How to Benchmark Your Own CSAT Score (Without the Guesswork)
Stop guessing: benchmark your CSAT by pulling at least 200-300 completed surveys per month, then segment by channel, agent, and ticket type. Compare your overall score to the industry average (using a CSAT benchmark report from a reliable source), then drill into specific segments. If your email CSAT is 72% but your live chat is 82%, the problem isn't your product; it's your email workflow. Benchmarking isn't a one-time audit; it's a living dashboard that tells you where to spend your improvement budget.
- Use a 1-5 scale for CSAT surveys; calculate as (number of 4s + 5s) / total responses * 100.
- Segment by channel: live chat, email, phone, WhatsApp, and social DMs all have separate benchmarks.
- Time-box your analysis: compare month-over-month and year-over-year to spot trends, not noise.
- Cross-reference CSAT with ticket volume: a dip during a spike in volume is normal; a dip during normal volume is a red flag.
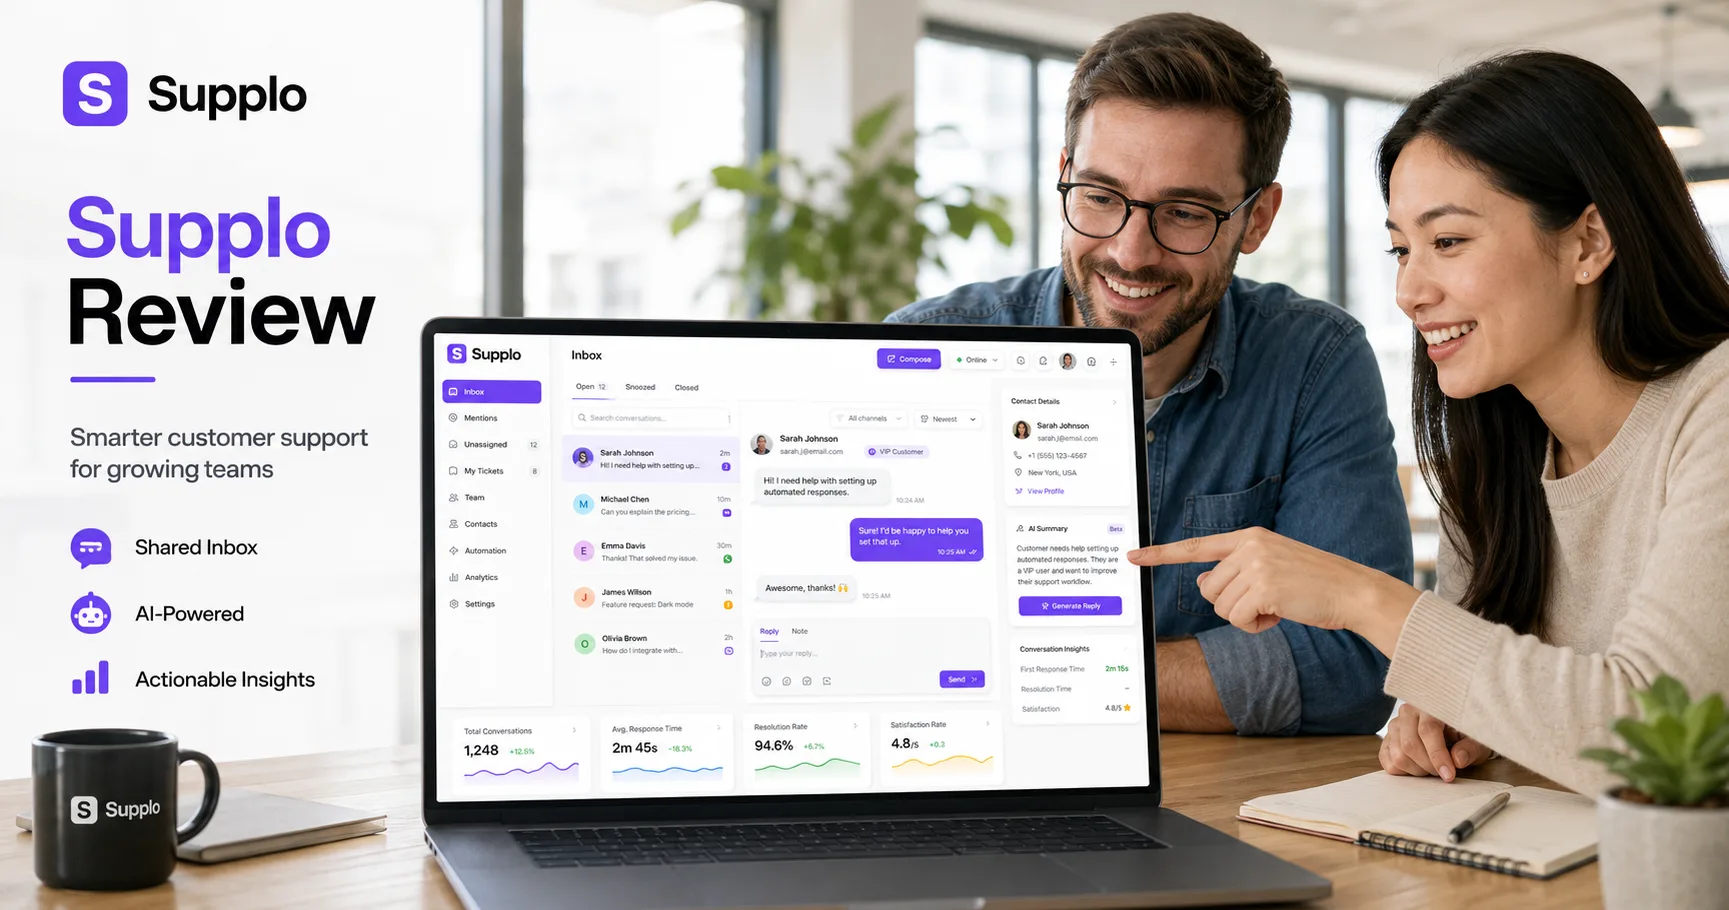
- Free tools exist to aggregate CSAT data, but a dedicated platform, such as Supplo's unified shared inbox, automates collection and segmentation.
Start benchmarking your CSAT for free. No credit card required, test Supplo's AI agent and shared inbox to see real improvements. Get started here.
Benchmarking isn't a one-time audit. It's a living dashboard that tells you where to spend your improvement budget.
Why Your Current CSAT Strategy Isn't Moving the Needle
Most companies collect CSAT scores but never act on them because they don't link feedback to specific interactions. You might see a 74% CSAT for "billing support," but have no clue whether the issue is long hold times, confusing invoices, or gaps in agent knowledge. If your strategy is "send a survey and hope," you're benchmarking for optics, not improvement. The real leverage comes from routing negative feedback directly to the team that can fix the root cause, fast.
- Survey fatigue is real: sending a CSAT survey after every interaction drops response rates below 10%.
- No real-time alerts: if an agent gets three 1-star ratings in a row, you should know instantly.
- Siloed channels: email CSAT is measured differently than phone or chat, leading to inconsistent benchmarks.
- No root-cause tagging: a low CSAT for "technical support" could be software bugs, agent training gaps, or documentation failures.
- Teams that link CSAT to agent coaching see 2x faster score improvement.
How to fix it: Add a WhatsApp support channel and align your survey touchpoints. If email surveys are ignored, try in-chat feedback after resolution.
If your survey scores flatline, it's time to change your tools. Start a free trial and see what happens when support works together.
The Hidden Cost of Low CSAT Scores (Revenue Leak Alert)
Low CSAT is a lagging indicator of churn. Telecom carriers lose 20-30% of customers annually just from poor support experiences, not bad coverage. In healthcare, a single frustrating billing interaction can prompt a patient to switch to a competitor's practice. The cost of acquiring a new customer is 5-7x higher than retaining an existing one, so every point drop in CSAT is a measurable revenue leak. If you think "good enough" support costs less, you're ignoring the hidden cost of lost customers.
- A 5% increase in CSAT correlates to a 10-15% reduction in churn in B2C telecom.
- Healthcare providers with CSAT below 75% see 25% fewer repeat patient visits.
- Low CSAT increases negative word of mouth: a dissatisfied customer tells 9-15 people.
- Every unresolved ticket that escalates to a supervisor costs 3 times as much to resolve.
- Flat-rate support platforms (like Supplo) eliminate the per-resolution cost barrier to improving CSAT.
A 5% increase in CSAT can cut churn by 10-15% in telecom. That's not theory, that's documented ROI.
How Supplo Flips Telecom and Healthcare CSAT Benchmarks
Supplo doesn't just help you match industry benchmarks, it helps you exceed them, even in notoriously low-scoring sectors like telecom and healthcare. By combining a self-learning AI agent that resolves common issues (password resets, billing queries, appointment confirmations) at $0.04 per resolution with a unified inbox that routes every channel (WhatsApp, Telegram, email, Instagram, Facebook) into one workspace, your team responds faster with full context. No per-seat fees means you can staff up without punishing your budget.
- The AI agent learns from your knowledge base, auto-resolving up to 70% of volume without human touch.
- Unified inbox means a patient's WhatsApp question and email follow-up appear in a single thread, with no lost context.
- Built-in auto-translate helps healthcare teams serve multi-language patient bases without friction.
- Flat monthly pricing (no per-seat or per-resolution fees) means improving CSAT doesn't inflate your support costs.
- Telecom teams use Supplo to consolidate email, Telegram, and WhatsApp support, cutting average handle time by 30%.
No per-seat fees. No per-resolution meter. Just flat-rate support that actually moves your CSAT. See the difference at Supplo.
Accept payments via Crypto, Binance Pay, Payeer, GCash, AmanPay, QIWI Wallet, DOKU, Nigeria and South Africa cards, Skrill, and Payoneer.
The CSAT Benchmark Report: What to Actually Track
A useful CSAT benchmark report contains more than just a single number. It tracks the overall score, channel-specific CSAT, agent-level CSAT, first-contact resolution (FCR) rate, and survey response rate. It flags deviations from the prior period and from industry benchmarks. Without these five numbers, you're flying blind. With them, you can pinpoint exactly which channel or agent needs coaching, and which workflows are costing you points.
- Overall CSAT: Your headline number, benchmarked against your industry.
- Channel CSAT: Which channels (chat, email, phone, WhatsApp) perform best and worst?
- Agent CSAT: Individual scores to identify training opportunities and top performers.
- FCR Rate: The strongest leading indicator of CSAT; tracks whether tickets are closed in one touch.
- Survey Response Rate: Low response rates indicate a skewed sample; aim for 15% or higher.
See real-world telecom and healthcare improvements from teams using Supplo to flip their benchmarks.
Key Takeaways
- Global average CSAT is 75-80%; telecom averages 68-72%, healthcare 70-80%.
- Industry benchmarks are essential: comparing with the wrong sector leads to wrong conclusions.
- Low CSAT costs revenue: a 5% increase can cut churn by 10-15% in telecom.
- Improving scores requires unified channels, real-time feedback action, and AI-driven self-service.
- Tools like Supplo's AI agent and shared inbox help telecom and healthcare teams exceed benchmarks without per-seat costs.
FAQ
What is a good CSAT score benchmark?
A good CSAT score typically falls between 75% and 85% across most industries. However, benchmarks vary: telecom averages around 68-72%, while B2B SaaS can reach 82%. The best benchmark is your segment-specific average.
How do I calculate my CSAT score?
Divide the number of satisfied responses (4s and 5s on a 1-5 scale) by the total number of survey responses, then multiply by 100. For example, 80 satisfied responses out of 100 equals an 80% CSAT score.
Why is telecom CSAT so low compared to other industries?
Telecom support faces high-stress interactions (billing disputes, outages, plan changes) and often forces customers through long IVR trees. Low first-contact resolution rates and fragmented channels further depress scores.
Can healthcare CSAT reach the same levels as retail benchmarks?
Yes, but it requires different drivers: empathy, appointment speed, billing clarity, and privacy. Healthcare teams using live chat and auto-translate see significant lifts in patient satisfaction.
How often should I check my CSAT benchmarks?
Monthly, at a minimum. Check channel and segment-level CSAT weekly if you're actively improving. Annual checks are useless; you'll miss trends and root causes.
What's a CSAT benchmark report, and where can I find one?
A CSAT benchmark report aggregates scores from hundreds or thousands of companies by industry and uses them to set comparison baselines. You can find them from customer experience research firms or aggregated by platforms like Supplo.
How do I improve CSAT score benchmarks for my business?
Start by unifying your support channels, investing in self-service AI for common queries, measuring FCR, and acting on negative feedback in real-time. Tools like Supplo's shared inbox and AI agent are built to do all of that without per-seat costs.
Compliance line: Supplo is not affiliated with any app or website. Please follow each app's terms and local regulations.