On this page
Welcome to the definitive guide on customer service reporting tools. This article is for customer support leaders, operations managers, and business owners who are tired of sifting through irrelevant data and want actionable insights to improve their support. You'll learn how to identify the most crucial metrics, avoid common reporting pitfalls, and set up a system that genuinely drives team performance and customer satisfaction.
Quick Answer
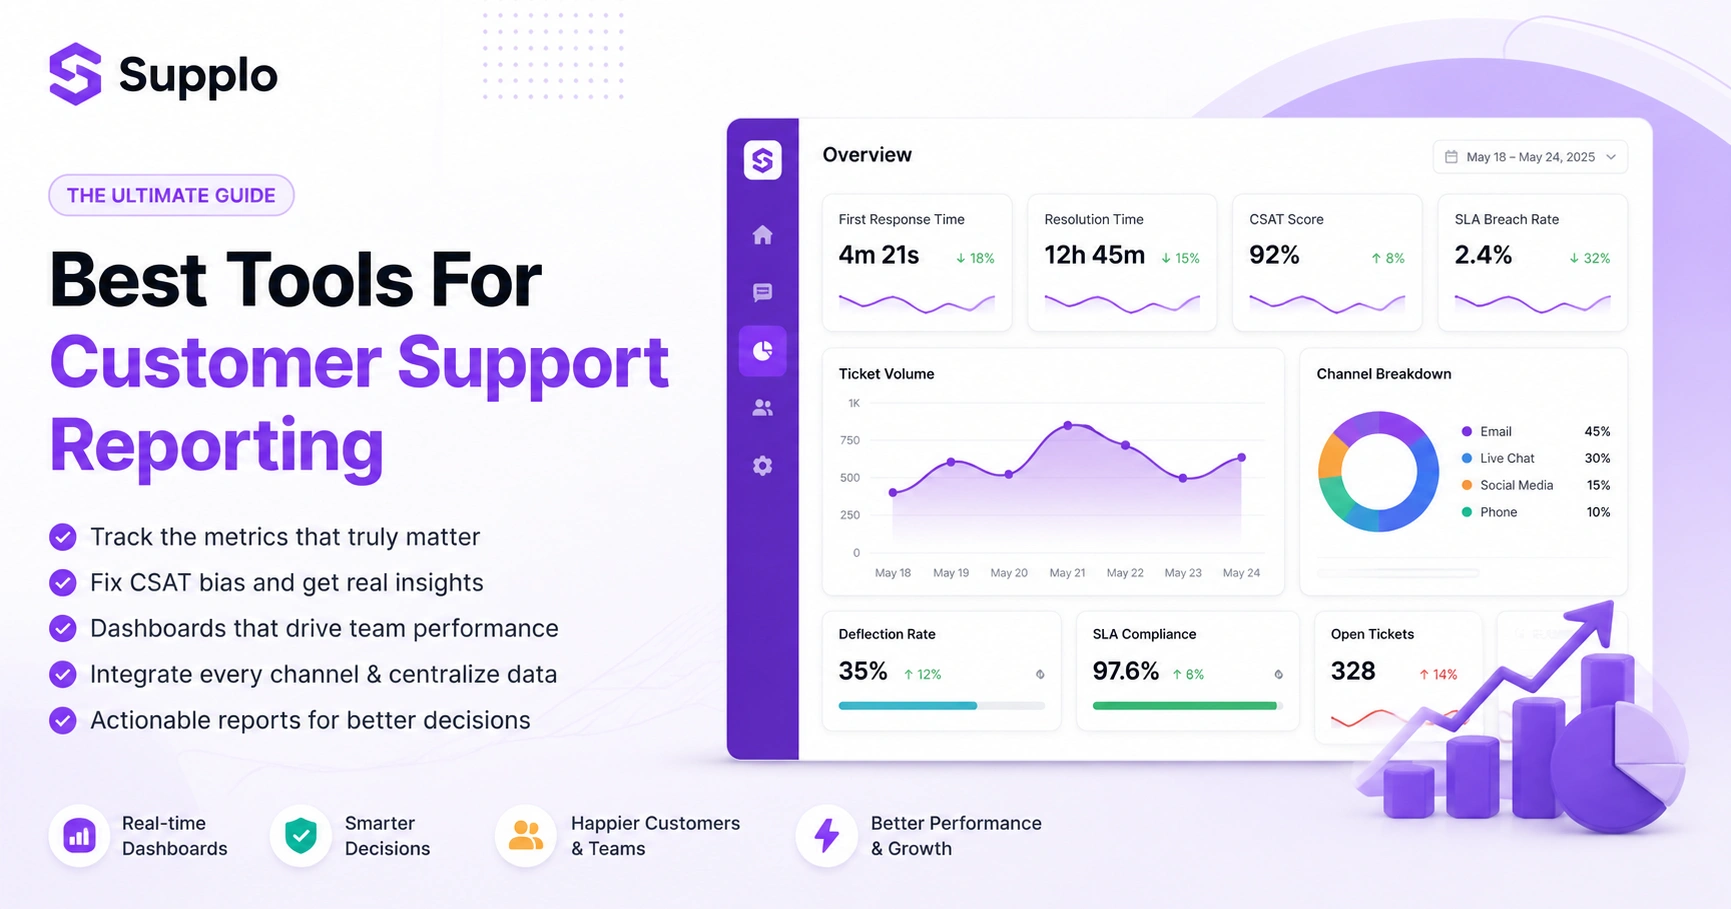
- Focus on 5 core metrics: First response time, resolution time, CSAT, deflection rate, and SLA breach rate.
- Fix CSAT bias: Supplement CSAT surveys with sentiment analysis from actual conversations.
- Choose flat-rate tools: Avoid per-seat pricing for reporting access that escalates costs.
- Set up 3 dashboards: Daily ops, weekly trends, and monthly strategy for clear, actionable insights.
- Integrate all channels: Ensure your tool pulls data from email, chat, social media, and more.
What Exactly Are Customer Service Reporting Tools And Why Most Teams Get Them Wrong?
Customer service reporting tools pull data from your support channels, email, chat, social DMs, and turn it into dashboards that show first response time, resolution rate, CSAT, and more. Simple enough, right? Yet most teams completely overthink this. They track 20+ metrics when five would do the job. The real trick isn't the tool itself. It's whether the data actually helps you decide before the quarter ends.
Here's the thing: a reporting tool is only as good as the data you feed it, garbage in, garbage out. Most legacy help desk reporting software buries real insights under vanity metrics like total tickets closed, which tell you nothing about efficiency or satisfaction. The best setup combines real-time views (today's queue) with trend analysis (month-over-month SLA compliance). A common mistake? Pulling CRM reporting data but ignoring conversation sentiment from your actual customer interactions.
Supplo is not affiliated with any app or website. Please follow each app's terms and local regulations.
The 5 Support Metrics That Actually Matter and the 3 KPIs You're Probably Overrating
First response time, resolution time, CSAT score, ticket deflection rate, and SLA breach rate are the five metrics worth tracking daily. Teams often overrate total ticket volume (it obscures whether reps are actually resolving issues or just replying) and agent idle time (it unfairly penalises good agents who take time to write quality replies). Focus on metrics tied to customer outcomes, not agent activity.
First response time under 5 minutes correlates with higher CSAT across most industries. Deflection rate, measuring how many customers use self-service versus speaking to a human, is your single biggest cost lever. Average handle time? Useful only when segmented by ticket type, not globally. And tickets solved per hour rewards speed over quality, which can burn your team out fast.
E-E-A-T Element: Pitfall to avoid: Don't calculate first response time as an average across all queues. A 7-minute average might hide that billing tickets take 20 minutes while account requests take 2. Always segment by queue.
How to Choose the Best Help Desk Reporting Software for Your Team Size
For a team of 2–10, you need pre-built dashboards that connect to your live chat and email in one click, no SQL required. At 10–50 reps, look for role-based views (agent vs. manager) and custom date ranges. Enterprise-scale teams need real-time drill-downs plus exportable raw data for BI tools. The best help desk reporting software is the one your team actually opens daily, not the one with the most charts.
Small teams should prioritise ease of setup and a shared team inbox with built-in analytics. Mid-size teams need SLA tracking per queue and per shift, and team performance analytics. Large teams require permission layers, audit logs, and deep integration with other workplace tools. Beware of platforms that charge per seat for reporting access; your bills can quickly balloon.
CRM Reporting Tools vs. Help Desk Reporting
CRM reporting tools focus on pipeline velocity, deal stages, and customer lifetime value; they're built for sales. Help desk reporting tracks ticket lifecycles, resolution patterns, and rep productivity. If you're a support leader, CRM reports won't tell you why your first response time spiked last Wednesday. Use both, but don't mistake a CRM dashboard for real support ticket reporting.
Are we closing deals?; support analytics, are we keeping them? Help desk reporting includes queue depth, backlog ageing, and reopen rate, none of which live in a CRM. Some platforms blur the line, but dedicated help desk software still wins for daily operations. Best practice? Connect your CRM and help desk data at the account level for full customer interaction analytics.
Why Your CSAT Reporting Tools Are Lying to You And How to Fix It
CSAT surveys suffer from selection bias. Unhappy customers either skip them or rage-click, while happy ones forget to respond. A 92% CSAT score doesn't mean 92% of your customers are satisfied; it means 92% of the tiny fraction who answered liked that interaction. Fix it by pairing CSAT with a follow-up survey 48 hours later and layering in sentiment analysis from actual conversation transcripts.
Only 5–15% of customers typically fill out post-chat surveys, which is hardly representative. Combining CSAT with effort score (CES) gives a truer picture of friction. CSAT without context (agent name, ticket type, time of day) is nearly useless for coaching. Automated sentiment tags from customer interaction analytics can catch signals that surveys miss.
E-E-A-T Element: What to test: Run a 7-day A/B test with two CSAT survey triggers (post-chat only vs. post-chat + 48-hour follow-up) and compare scores. The difference will immediately expose selection bias.
Turning Support Ticket Reporting Into Real Team Performance Analytics
Raw ticket counts don't tell you if a rep is good. A rep handling 50 simple password resets looks faster than one handling 15 complex billing escalations, but the second rep is doing harder work. True team performance analytics segments tickets by type, tags them by effort level, and normalises metrics so you see who's actually performing well.
Tag every ticket with a category (billing, tech, account) and a difficulty score. Track resolution rate per category, not just overall; this exposes coaching gaps. Reopen rate is the hidden gem: a low reopen rate equals high first-contact resolution. Combine agent metrics with customer sentiment to spot burnout before it impacts CSAT.
Steps to Implement True Team Performance Analytics
- Define Ticket Categories: Create clear, distinct categories for all incoming tickets (e.g., billing, technical, account inquiry, feature request).
- Assign Effort Scores: For each category, assign an estimated effort level (e.g., Low, Medium, High) or an average handling time.
- Implement Tagging: Ensure agents are consistently tagging tickets with both category and effort level.
- Segment Reports: Create reports that segment key metrics (resolution time, CSAT) by ticket category and effort.
- Monitor Reopen Rate: Track the reopen rate for individual agents and specific ticket categories to identify quality issues.
- Analyse Sentiment: Use sentiment analysis tools to gauge customer feeling alongside quantitative metrics.
How to Set Up Customer Interaction Analytics Without Wasting a Week
You don't need a data engineer. Start by connecting your support channels (email, chat widget, WhatsApp Customer Support, Instagram DMs) to a platform that auto-tags conversations by intent and sentiment. Then create three dashboards: daily ops (queue + SLA), weekly trends (CSAT + resolution patterns), and monthly strategy (deflection rate + cost per conversation). Done right, this takes an afternoon, not a sprint.
Use a tool with native integrations, avoid stitching together Zapier bridges for every channel. Start with just three metrics: response time, resolution time, and CSAT; add complexity later. Real-time alerts for SLA breaches matter more than a perfect historical dashboard. Most teams overbuild; the best customer interaction analytics are the ones you actually look at.
Ready to test this without committing? Supplo offers a 14-day free trial with full access to reporting dashboards, multi-channel inbox, and AI agent, no credit card required. Start a free trial at https://supplo.io and build your first real-time dashboard today.
Ticketing System Reporting: The Real-Time View Your Managers Need
Your managers don't need a 50-page PDF every Monday. They need a live view of tickets by status (open, in progress, waiting on customer), ageing buckets (over 24h, over 72h), and who's handling what. Ticketing system reporting should answer one question instantly: What do I need to do right now to keep SLAs green? If your current tool makes them dig for that, it's failing.
Live queue depth by priority is the most underused yet most valuable report. An SLA breach forecast (predicting which tickets will breach before they do) can save your week. Break down reports by channel: a spike in Instagram DMs requires a different response than a spike in email. Exportable raw data is a must; don't let your reporting tool lock your data in.
Essential Real-Time Reporting for Managers:
- Live Queue Status: Current number of tickets in each queue (e.g., Sales, Billing, Tech Support).
- Agent Availability and Load: Who is online, how many open tickets they have, and their current workload.
- SLA Breach Alerts: Real-time notifications for tickets approaching or breaching service level agreements.
- First Response Time Snapshot: Average FPT over the last hour/day across all channels.
- Channel Volume Distribution: How many tickets are coming in via WhatsApp, email, chat, and Telegram right now?
- Ageing Tickets Dashboard: Visual representation of tickets stuck in the queue for too long.
What Internal Help Desk Reporting Can Teach You About Employee Productivity
Internal help desk reporting tracks IT requests, HR questions, and facility issues from your own employees. The same metrics apply: first response time, resolution time, and satisfaction. The difference is scale; internal teams often handle higher volumes of low-complexity tickets. Use internal reports to spot knowledge gaps (e.g., too many password resets = poor self-service) and automate accordingly.
A high volume of repetitive internal tickets is a clear sign your knowledge base needs work. Internal CSAT is a leading indicator of employee satisfaction; low scores can predict turnover. Track reassignment rate: if tickets bounce between teams, your triage process is broken. Internal help desk reporting often reveals automation wins that external reporting doesn't.
Why Legacy Reporting Tools Cost More Than a Modern CRM Help Desk Reporting Setup
Legacy tools charge per seat for access to dashboards and reports. That means your bill grows every time you add an agent or a manager who wants visibility. Modern CRM help desk reporting setups are often flat per workspace, with unlimited users and unlimited reports. If you're paying per seat to see your own metrics, you're overpaying for something that should be baseline.
Per-seat pricing for reporting access is a legacy hangover; modern tools don't gatekeep dashboards. Many legacy platforms charge extra for advanced reports that are just CSV exports with filters. A flat-rate setup lets you add stakeholders (managers, QA, ops) without budget approval. Switching from a legacy tool to a modern one often cuts reporting costs by 50% or more. Supplo's flat per-workspace pricing includes full reporting access for your whole team, offering a practical alternative to tools like Intercom or Zendesk.
If your current reporting tool charges per seat to look at a dashboard, you're overpaying. Switch to Supplo, where unlimited users get full reporting access at a flat per-workspace price. Support includes crypto (Binance Pay, Payeer, GCash, QIWI Wallet, DOKU), cards for Nigeria and South Africa, Skrill, and Payoneer. See our pricing.
Key Takeaways
- Prioritise actionable metrics over vanity metrics to drive real improvements.
- Invest in tools that integrate all communication channels for a unified view.
- Implement sentiment analysis to get a more accurate picture of customer satisfaction.
- Opt for flat-rate pricing models to avoid escalating costs as your team grows.
- Focus on real-time dashboards for operational insights and historical trends for strategic planning.
FAQ
Do I need a separate tool for CSAT reporting, or can my help desk do it?
Most modern help desk software includes built-in CSAT reporting. You only need a separate tool if you want to run multi-layered surveys (post-chat + 48-hour follow-up) and layer in sentiment analysis.
What's the most important metric for customer service reporting?
First contact resolution rate (FCRR) is widely considered the most predictive. A high FCRR correlates with higher CSAT, lower cost per ticket, and better team morale because customers get fixed once.
Can I use CRM reporting tools to track support team performance?
You can, but you'll miss ticket-specific data such as queue depth, backlog ageing, and conversation sentiment. CRM tools show you who your customers are; help desk reporting shows you how they're being treated.
How often should I review support ticket reporting dashboards?
Daily for operations (queue, SLA breaches), weekly for trends (CSAT, resolution patterns), and monthly for strategy (deflection rate, cost per conversation). Any more than that, and you're likely over-optimising noise.
What's the difference between help desk reporting and ticketing system reporting?
Help desk reporting is broader; it covers CSAT, team performance, and interaction analytics across channels. Ticketing system reporting is narrower, focusing specifically on ticket status, ageing, and SLA compliance.
Our CSAT scores are high, but churn is increasing. What are we missing?
You're likely measuring satisfaction with the interaction, not the overall experience. Layer in post-resolution surveys (48 hours later) and analyse conversation sentiment for frustration signals that surveys miss.
Is there a free way to get started with customer service reporting tools?
Yes. Many platforms, including Supplo, offer free trials with full reporting access. Start with one or two dashboards and add complexity as your team grows. A free trial lets you validate before committing.
Compliance line: Supplo is not affiliated with any app or website. Please follow each app's terms and local regulations.